Who are the pilot users of the SNIC Science Cloud?

The SNIC Science Cloud is a project run by the Swedish National Infrastructure for Computing. The goal is to investigate if and how cloud resources should be provided as a complement to the more traditional HPC-resources. An important part of this investigation is our pilot users.  The project has run in two main phases:

1. 2013-2014: A small-scale pilot system and a small number (3-5) of predefined pilot use-cases, chosen to highlight the utility of cloud resources. Advanced user support in the form of SNIC Application Experts (AEs) were available to assist the pilot users.

2. 2015-2016: A scaled up infrastructure with more resources, and an open process for user-initiated project requests. In this phase, we have concentrated on training workshops and creating open source tutorials instead of targeted advanced support.

In the summer 2016 we reported on the growth of project requests and promised to follow up with a more in-depth analysis of who these users are and what they are doing. We have looked in our project database at all the projects that registered for SSC resources in 2015-2016 (as of Oct. 11). During the period, we have had 57 project requests.
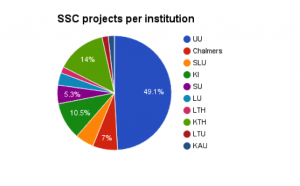
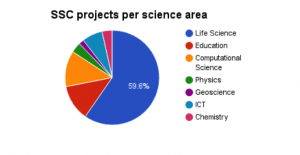
As can be seen, Life Science users dominate. Of these, a large fraction are affiliated with SciLifeLab/NBIS. This is expected since the Bioinformatics community was an early adopter of service-oriented computing, and since their applications often have the need to integrate multiple software. Many Swedish universities are represented, but Uppsala University (UU), The Royal Institute of Technology (KTH) and the Karolinska Institute (KI) dominate. This is likely a consequence of the fact that these institutions’ involvement in SciLifeLab, and that both KTH and UU has served as hosts for the SSC project, presumably increasing awareness of SSC amongst the scientists.  

In the period Sep 11-Oct 11, a total of 47000 instance hours were deployed in 31 different projects. Using a reference instance type (flavor) with 4 VCPUs and 8GB RAM, this corresponds to an average of 130 instances continuously deployed during the month. We will follow up on the resource usage patterns over time in future posts, when we have more fine-grained data.

So what are the users doing with the SSC OpenStack resources? It appears that development and testing of software and services, as well as exploring the cloud computing paradigm for old and new types of applications are still the dominating use case. In common to most projects is the need for flexible customization of the computing environment, made possible by virtualization. Many projects also want to provide their solutions as services to serve their own specific community.

Some projects are making more substantial use of the IaaS resources, making use of advanced tools for contextualization, automation and orchestration to achieve quite a diverse range of objectives. In common to all these projects is that they have access to own expertise on distributed and cloud computing in the project groups. To serve as an inspiration to new users, we have during 2016 highlighted some of them as user success stories:

Elastic proteomics analysis in the Malmstroem Lab.

Processing ozone data from the Odin satellite at Chalmers University of Technology.

Estimation of failure probabilities with applications in underground porous media flows.  

Virtual Research Environment for Clinical Metabolomics.  

So what will happen in 2017? A projection is hard to provide, but given the global trend that private/community IaaS becomes more and more common also in academia, observations made by our partners in the Nordic Glenna project, and with the momentum created via the European OpenScienceCloud initiative, we believe that the interest in cloud resources will keep increasing rapidly. 

Fortunately, in the SSC project we are in a good position to meet an increased demand due to our architectural design based on regions, in which we can leverage previous generation HPC hardware at multiple geographic locations to quickly add compute hosts at low cost. We have now integrated resources at three HPC-centra, UPPMAX, C3SE and HPC2N and can if needed scale resources to over 5000 physical cores and 1PB of storage during 2017. This model also opens up for substantial user communities to enter SSC with their own dedicated regions. We also hope to start looking into public-private partnerships to secure a larger variety of SLA-backed resources and to allow for users to burst outside of the allocated quotas.
Scalable processing of ozone data from the Odin satellite

The Odin satellite has measured ozone and related gases in the stratosphere and mesosphere for more than 15 years. This is one of the longest data series with global coverage that exists in atmospheric science. To make sure we can provide the best possible reference data set to the science community ESA has funded a total overhaul of the data set. This includes everything from review of the calibration algorithm of the sensor, to a complete review of the algorithms that provide concentrations of the different species at different heights and locations in the atmosphere.

The instrument is a passive sub millimeter radiometer, measuring emitted energy from different molecules through the limb of the atmosphere. The atmosphere is scanned over different heights around 60 times an orbit and the satellite makes about 15 orbits a day. That way measurements quickly cover most of the Earth’s atmosphere. As an example we have been able follow the development of the ozone depletion over the polar regions. We can also follow the circulation of air masses globally.

Technology

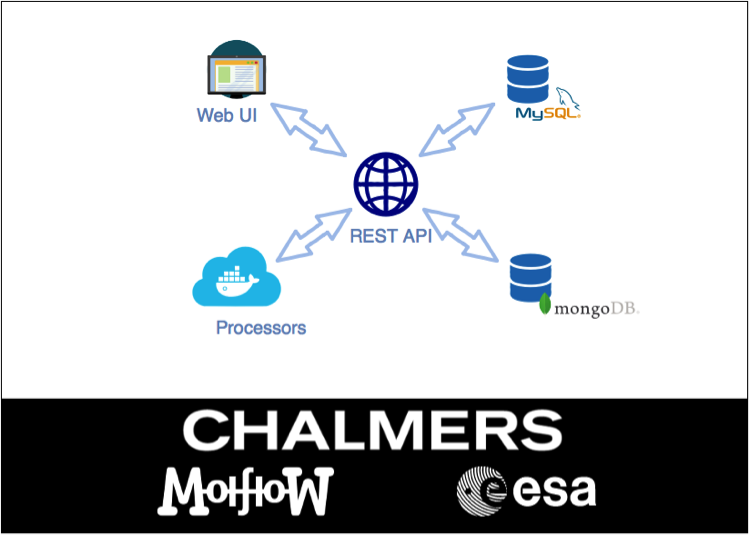
The Odin science community is using the SNIC Science Cloud. This enables scalable processing of Odin data both for testing of alternative algorithms and standard products.

To be able to process the dataset as quickly as possible we have packaged a set of “processors” in docker images ready to be deployed at any docker enabled computer. These docker images are self-contained with auxiliary datasets and code ready to be fed with measurements from the Odin satellite. Once the docker images are deployed the container asks the Odin-API, a REST service, for the next available measurement and starts immediately to crunch the data. When the process is done it delivers the results back to the Odin-API and starts over with a new measurement.

Users can browse and download data from the user interface http://odin.rss.chalmers.se and power-users can communicate directly with the REST-API to analyse data programmatically or start new processing campaigns.

Proteomics analysis using cloud infrastructure

Proteomics is the study of the global protein expression of cells and tissues. In proteomics, measurements are often carried out using mass spectrometers and the resulting data is both complex and large in volume. Proteins are complex macromolecules consisting hundreds or thousands of 20 amino acid types. Each amino acid can also undergoes modifications and this result that an estimated 1 million different protein types exists in complex organisms such as humans and their abundance varies over 7 orders of magnitude.

Computational proteomics aims at generating interpretable information from the thousands of mass spectra produced each hour. In general, the computational workflows need to be adapted to new data acquisition strategies and sometimes even per project. To accommodate this, typical workflows consist of many tools produced by research groups, consortia or companies. Below, we describe the technology stack we use to provide stable workflows to both experienced and novice users, yet remain flexible to accommodate special analysis cases.

All produced data, both measured and derived, is ingested into a data manager referred to as openBIS (Bauch et al 2011), which is ultimately stored on Swestore. Workflows can automatically stage data on the computation infrastructure in use. GC3PIE is used to manage the workflow and to interact with the computational resources as follows; a new workflow is submitted by a user, the GC3PIE head node downloads the data, creates cloud workers that then executes the various tools that constitutes the workflow. The final result data is registered in the data manager in relation to the input data. The result data consist of both result data and interactive reports.

Johan Malmström (Lund University) and Lars Malmström (ETH Zurich)

Using cloud computing for estimating failure probabilities with applications in underground porous media flows

In this guest post, Fredrik Hellman, a PhD student at the Division of Scientific Computing, Department of Information Technology, Uppsala University, report on how cloud computing resources in SSC were used in recent work with collaborators at UU and Chalmers/GU. 

In many engineering applications the probability of system failures are of particular interest. A special application is the assessment of storage capacity of underground carbon dioxoide storage reservoirs,where a failure is that the capacity of the target reservoir is smaller than expected. Since the rock properties are generally uncertain, the uncertainty in the reservoir capacity is also large.

The SNIC Science Cloud was used in our work on estimating failure probability to assess the performance of four different Monte Carlo method setups for estimating failure probability in a porous media fluid flow simulation with uncertain rock properties. For all four methods, the basic algorithm was to generate a set of realizations of the uncertain rock properties and distribute the work of performing the simulation for each realization in a network of virtual machines in the SNIC Science Cloud. All algorithms thus exhibit single program, multiple data (SPMD) parallelism.

snicblog

The code performing the simulations was written in Python, using
finite element assembly routines from the FEniCS project. The project benefited from using a cloud based service mainly for two reasons. First, the virtualization allowed for good control over the software environment. Experimental versions of software could easily be used without administrative overhead. Second, the IPython based MOLNs software for setting up and managing a virtual computing network for distributed computations was readily available and simplified the management of the computations.

Virtual Research Environments for Clinical Metabolomics

PhenoMeNalLogo

PhenoMeNal is a 3-year EU Horizon 2020 project (2015-2018) that will develop a standardised e-infrastructure for analysing medical metabolic phenotype data. This comprises development of standards for data exchange, pipelines, computational frameworks and resources for the processing, analysis and information-mining of the massive amount of medical molecular phenotyping and genotyping data that will be generated by metabolomics applications now entering research and clinic.

At the Spjuth research group we lead WP5; “Operation and maintenance of PhenoMeNal grid/cloud” and our aim is to provide PhenoMeNal and researchers with the capability to spawn secure Virtual Research Environments (VRE or VE) with easy access to scalable, interoperable data and tools for data analysis. These virtual environments should be able to run on most hardware architectures ranging from single laptops/workstations, to private and public cloud (IaaS) providers.

We use MANTL to set up, and to provide, a microservice-oriented virtual infrastructure. In PhenoMeNal, all partners provide tools as Docker images, , that are automatically built, tested, and pushed to DockerHub, by a continuous integration system (Jenkins). Within MANTL we provide long-running services using Marathon, including Jupyter and Galaxy workflows systems, that can orchestrate microservices-based pipelines using e.g. Chronos or Kubernetes.

Phase3 Draft Budget

So far we have successfully provisioned PhenoMeNal VRE on Google Cloud Platform, EBI Embassy Cloud (OpenStack), and SNIC Science Cloud (OpenStack). We are currently experimenting with Packer for speeding up the provisioning of virtual machines within the VRE, and Consul for federating multiple VREs. Another ongoing project is to use Apache Spark for distributed data analysis within the VRE.

Links:

http://www.farmbio.uu.se/forskning/researchgroups/pb/PhenoMeNal/

http://www.farmbio.uu.se/forskning/researchgroups/pb/Data-intensive/

http://phenomenal-h2020.eu/